How I Built One Dashboard for All My Self-Hosted Services
How I built fzlaunchpad: a fast, YAML-configured dashboard that puts my self-hosted services and their current status on one page.
 Mohammad Afzal
Running several services on one machine creates a surprisingly ordinary problem: the services may be organized, but their addresses are not.
My Raspberry Pi hosts tools for notes, files, shell access, containers, documents, photographs, music, and monitoring. Each one has its own URL. Browser bookmarks helped for a while, but they did not tell me whether a service was reachable, and they did not give the server a clear front door.
I wanted one page that answered two questions:
- What is running on this machine?
- Where do I open it?
That became fzlaunchpad, a small React and TypeScript dashboard driven by a YAML file. It runs as a static website, needs no application database, and is available as a ready-to-run Docker image.
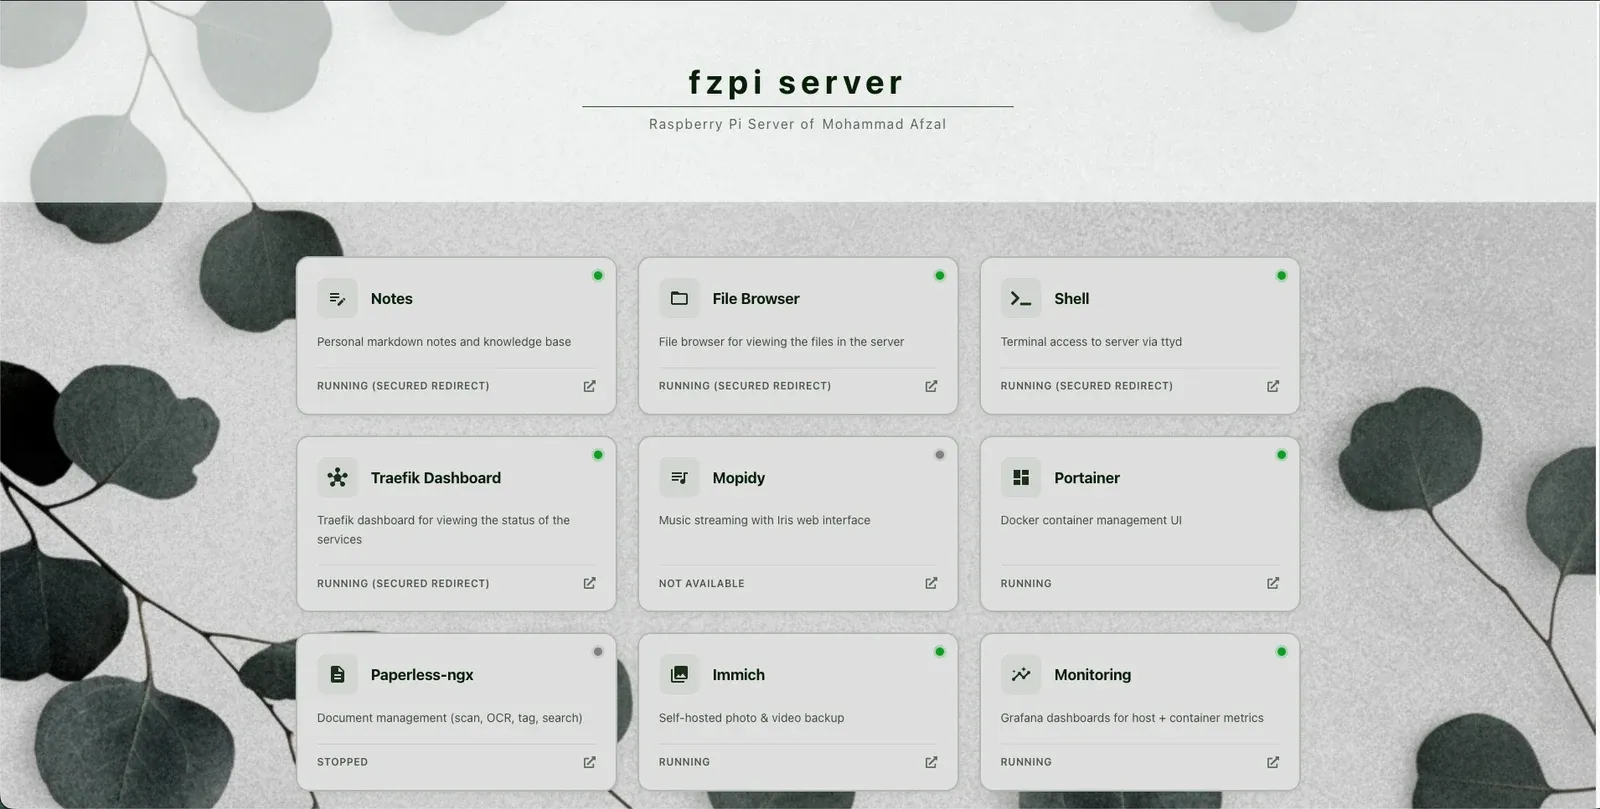
What I wanted from the dashboard
I did not need another large platform to operate. The dashboard itself should have almost nothing to maintain.
My requirements were:
- load quickly on a Raspberry Pi and other low-power machines;
- keep service definitions in a readable, versionable file;
- show a clear name, description, icon, link, and current state for each service;
- adapt to desktop and mobile screens;
- allow the visual theme to belong to the machine it represents;
- run with one container and sit comfortably behind any reverse proxy.
This led to the most important design decision: fzlaunchpad is
static-first. Vite builds the React application, and Caddy serves the
compiled files from a small container. In the visitor’s browser, the
application loads config.yaml, renders the service cards, and runs any
configured health checks.
There is no separate API for managing the dashboard. Updating it means editing the YAML file.
Start fzlaunchpad with Docker
The quickest way to see the default dashboard is:
docker run -d \
  --name fzlaunchpad \
  --restart unless-stopped \
  -p 8080:80 \
  afzalex/fzlaunchpad:latest
It becomes available at:
http://localhost:8080For a real installation, I keep the configuration and background images outside the container:
mkdir -p fzlaunchpad/images
cd fzlaunchpad
After creating config.yaml, I mount both locations read-only:
docker run -d \
  --name fzlaunchpad \
  --restart unless-stopped \
  -p 8080:80 \
  -v "$PWD/config.yaml:/usr/share/caddy/config.yaml:ro" \
  -v "$PWD/images:/usr/share/caddy/images:ro" \
  afzalex/fzlaunchpad:latest
The read-only mounts are deliberate. The container only needs to serve those files; it does not need permission to change them.
The repository also publishes downloadable static builds and documents a Compose setup in its current README.
Describe the dashboard in YAML
Here is a compact configuration with three services. The hostnames use
example.com; replace them with addresses that are reachable from the
browsers opening the dashboard.
server:
  name: "home server"
  subtitle: "Self-hosted services on {hostname}"

services:
  - name: "Portainer"
    description: "Docker container management"
    icon: "MdDashboard"
    url: "https://portainer.example.com"
    healthCheckUrl: "https://portainer.example.com"

  - name: "Photos"
    description: "Self-hosted photo and video library"
    icon: "MdPhotoLibrary"
    url: "https://photos.example.com"
    healthCheckUrl: "https://photos.example.com"

  - name: "Documents"
    description: "Searchable document archive"
    icon: "MdDescription"
    url: "https://documents.example.com"
    healthCheckUrl: "https://documents.example.com"

footer:
  enabled: true
  content:
    - type: "text"
      content: "Home server · {year}"

theme:
  backgroundImage:
    url: "/images/background.jpg"
    opacity: 1
    position: "center"
    size: "cover"
    repeat: "no-repeat"
  colors:
    background: "#bebfbe"
    cardBackground: "#dedede"
    mediumAccent: "#2d531a"
    darkAccent: "#eeeeee"
    text: "#071e07"
    headerBackground: "#fcfffeaa"
    headerText: "#071e07"
    footerBackground: "#c9c9c9aa"
    footerText: "#071e07"
    serviceStatus:
      "0": "#808080"
      "200-299": "#009d24"
      "300-399": "#3b82f6"
      "400-499": "#ef4444"
      "500-599": "#f59e0b"
      "checking": "#3b82f6"

statusMapping:
  "0": "stopped"
  "200-299": "running"
  "300-399": "redirected"
  "400-499": "error"
  "500-599": "warning"
The main parts have distinct jobs:
| Section | What it controls |
|---|---|
server | The machine name, subtitle, and optional header content |
services | The cards, links, icons, descriptions, and health-check URLs |
footer | Optional text and links at the bottom of the page |
theme | Background image, colours, cards, header, footer, and status dots |
statusMapping | The label shown for each HTTP status code or range |
The configuration is ordinary text, so I can keep it in Git, review a change, or reuse it as the starting point for another machine.
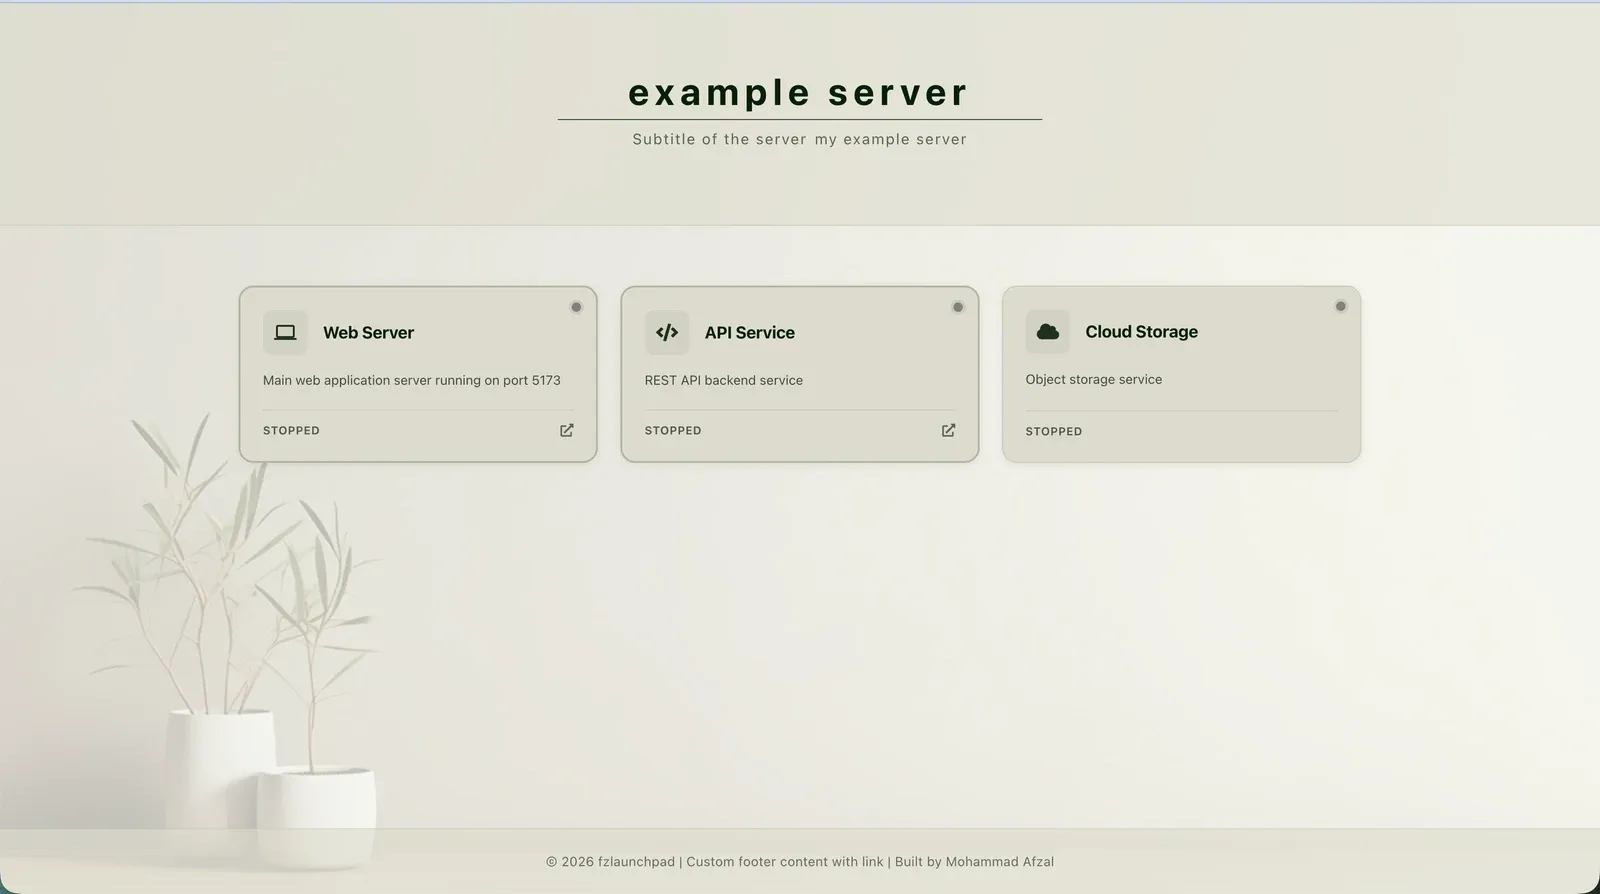
A card is both a link and a small status view
Each service can define two addresses:
urlis opened when the card is selected;healthCheckUrlis requested periodically to determine the displayed status.
They can be the same, but they do not have to be. A service might open its
normal user interface while exposing a smaller /health endpoint for the
check.
The status label and dot come from the HTTP response. The configuration can
map an individual code or a range, which is useful when a protected service
returns a response such as 401 even though it is running correctly.

The health checks happen in the visitor’s browser. That detail has two useful consequences:
- the dashboard reports whether the service is reachable from the reader’s current network;
- the target service’s browser security rules can affect how much information the check can read.
fzlaunchpad first attempts a normal CORS request. If the browser blocks access
to the response, it tries a no-cors request. A successful opaque request can
confirm basic reachability, but the browser cannot reveal its actual status
code. The interface therefore treats that result as reachable rather than
pretending it has complete monitoring data.
This makes the status indicator a convenient launchpad signal, not a historical monitoring or incident-alerting system. I still use dedicated monitoring tools when I need metrics, alerts, or evidence of what happened while nobody had the dashboard open.
Make the page belong to the machine
A server dashboard is opened frequently, so small visual choices matter. fzlaunchpad lets the YAML configuration control:
- the page and card colours;
- header and footer colours;
- a background image, position, size, repeat mode, and opacity;
- colours for exact HTTP codes or status-code ranges;
- icons from Font Awesome and Material Design through React Icons.
It also supports placeholders such as {hostname}, {year}, {date}, and
{origin} in names, descriptions, links, and footer content. A configuration
can therefore adapt to the address from which it is loaded without rebuilding
the application.
The theme in my Raspberry Pi installation uses a quiet botanical background and muted cards. The design is restrained enough that the service names and states remain the useful part of the page.
Mobile-friendly design
I did not want a separate mobile dashboard. The same cards collapse into a single-column layout, keeping their status, description, and link target.
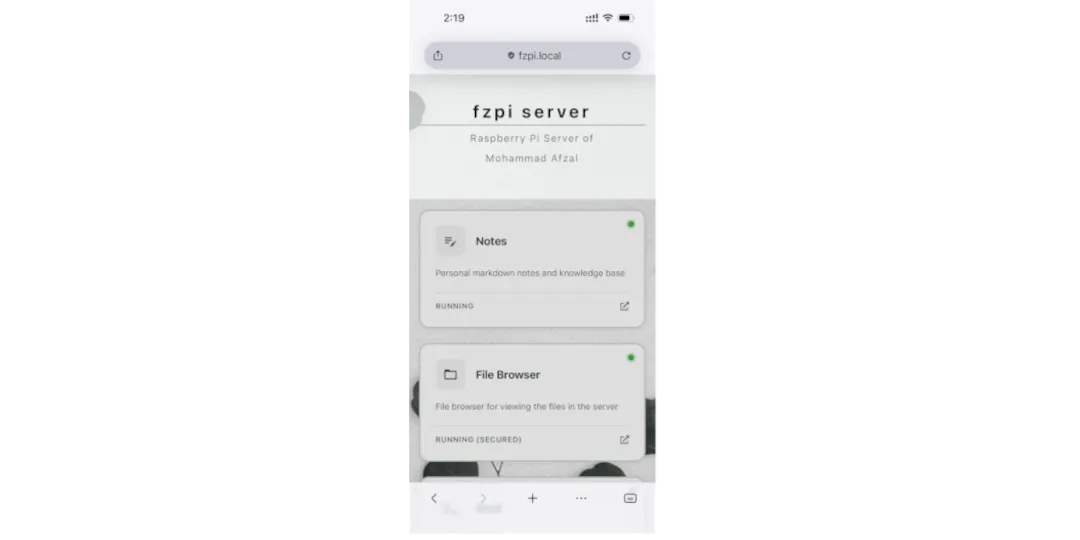
That matters in practice. I often need the dashboard when I am not already sitting at a computer—for example, to open a service from my phone or quickly confirm that a machine is reachable.
Why this arrangement has stayed useful
fzlaunchpad does not try to discover every container automatically or become the control plane for the server. Its job is smaller:
- collect the important destinations;
- make their purpose visible;
- show a useful indication of their present state;
- remain easy to replace, move, and configure.
The server continues running exactly as it did before. fzlaunchpad simply gives it a front page.
That boundary is why the project works well for my setup. A Raspberry Pi, NAS, VPS, development machine, or small office server can all use the same application, while the YAML file explains what belongs on that particular machine.
The source and full configuration reference are available on GitHub. The ready-made container is published on Docker Hub, and I also wrote an earlier overview on LinkedIn.
What began as a solution to scattered bookmarks is now the first page I open when I want to understand a server. One dashboard does not run all my self-hosted services; it makes all of them easier to find.

Senior Staff Engineer writing about cloud systems, automation, product engineering, and the practical work of building reliable software.
Continue reading

How I Added Self-Hosted Comments to My Static Blog
How I added Google-authenticated comments to an Astro blog with Remark42, Docker, a dedicated comments subdomain, and Traefik.

Running split DNS at home with dnsmasq
How to resolve the same hostname locally at home and through a public route outside, using dnsmasq on a Raspberry Pi.
A professional email address on my own domain—for free
How I connected Cloudflare Email Routing, SMTP2GO, and Gmail so I could receive and send mail as contact@afzalex.com without paying for a hosted mailbox.